
A busy dining room can hide menu items that sell well but leave too little money to cover operating costs. For Tennessee restaurant owners, measuring menu profitability starts with connecting POS sales data to current recipe costs.
Your reports show what guests order and what they pay; ingredient costing reveals how much each sale contributes toward running your business. Start with a consistent reporting period, then use that information to guide pricing, purchasing, and menu decisions.
Key Takeaways
- Build item-level POS reports with consistent periods and categories. Use net sales after discounts and refunds, excluding sales tax and tips, and separate channels or service periods when costs differ.
- Connect sales to current recipe costs. Contribution margin is selling price minus portion cost; food cost percentage compares recipe cost with selling price.
- Measure popularity and contribution separately. Sales mix shows guest demand, and the menu engineering matrix groups items as Stars, Plowhorses, Puzzles, or Dogs.
- Test pricing, recipes, and placement against equivalent periods. Track realized contribution, order volume, costs, guest count, and customer feedback.
1. Build a Reliable Item-Level POS Report
Accurate menu analysis depends on comparing the same items, channels, and reporting periods. Start with a full month of sales data, separated into entrees, appetizers, desserts, and beverages.
Export sales, net revenue, and discounts
Your product-mix report should include item name, quantity sold, gross sales, discounts, refunds, and net sales. Add modifiers and sales channel where available to calculate sales mix, or item demand within each category.
Use revenue after discounts and refunds, excluding sales tax and tips. A restaurant’s net sales report isn’t the same as its payment-processing settlement, which may reflect fees and other adjustments.
Review discounts separately. A popular entree promoted through frequent coupons may generate less contribution than its listed price suggests. Our guide to essential restaurant POS features covers reporting capabilities that support this analysis.
Keep comparisons consistent
Separate lunch and dinner when prices or portions differ. For a Nashville restaurant, analyzing dine-in and delivery separately also reveals differences in packaging and channel costs.
Combine duplicate item names, but preserve meaningful recipe variations. Keep comps and voids visible: a prepared dish that was refunded still consumed ingredients, while an order canceled before preparation may not have.
2. Connect Sales With Current Ingredient Costs
POS reports become more useful when sales data connects to standardized recipes and current supplier prices. Some systems include integrated recipe costing; others require inventory software or a spreadsheet. POS data alone won’t capture every ingredient cost.
Calculate the complete portion cost
Include every ingredient served: the main protein, side, sauce, garnish, cooking oil, and bread. Convert purchase units into usable servings to calculate portion cost, accounting for trimming and cooking yield.
For the margherita pizza calculation, a $37.50 batch that yields ten portions has a $3.75 portion cost. Usable yield matters because purchased weight doesn’t always match served weight.
Use current invoice prices when making pricing decisions. If you use spreadsheets for recipe costing, update costs whenever invoice prices change. Keep earlier cost snapshots so historical comparisons remain meaningful.
Compare theoretical and actual usage
Recipe costs assume the kitchen follows the standard portion. Inventory counts show whether actual consumption matches that expectation.
Calculate actual ingredient usage as beginning inventory plus purchases minus ending inventory. Compare that result with recipe-based usage for the period, accounting for transfers and staff meals.
Overportioning, spoilage, and unrecorded comps can explain differences. Connect these findings with restaurant POS inventory and analytics to help managers adjust purchasing and preparation without weakening the guest experience.
3. Calculate Food Cost and Contribution Margin
Food cost percentage compares ingredient expense with selling price, while food cost in dollars shows the ingredient expense for an item. Contribution margin measures the dollars left after paying the portion cost for each serving.
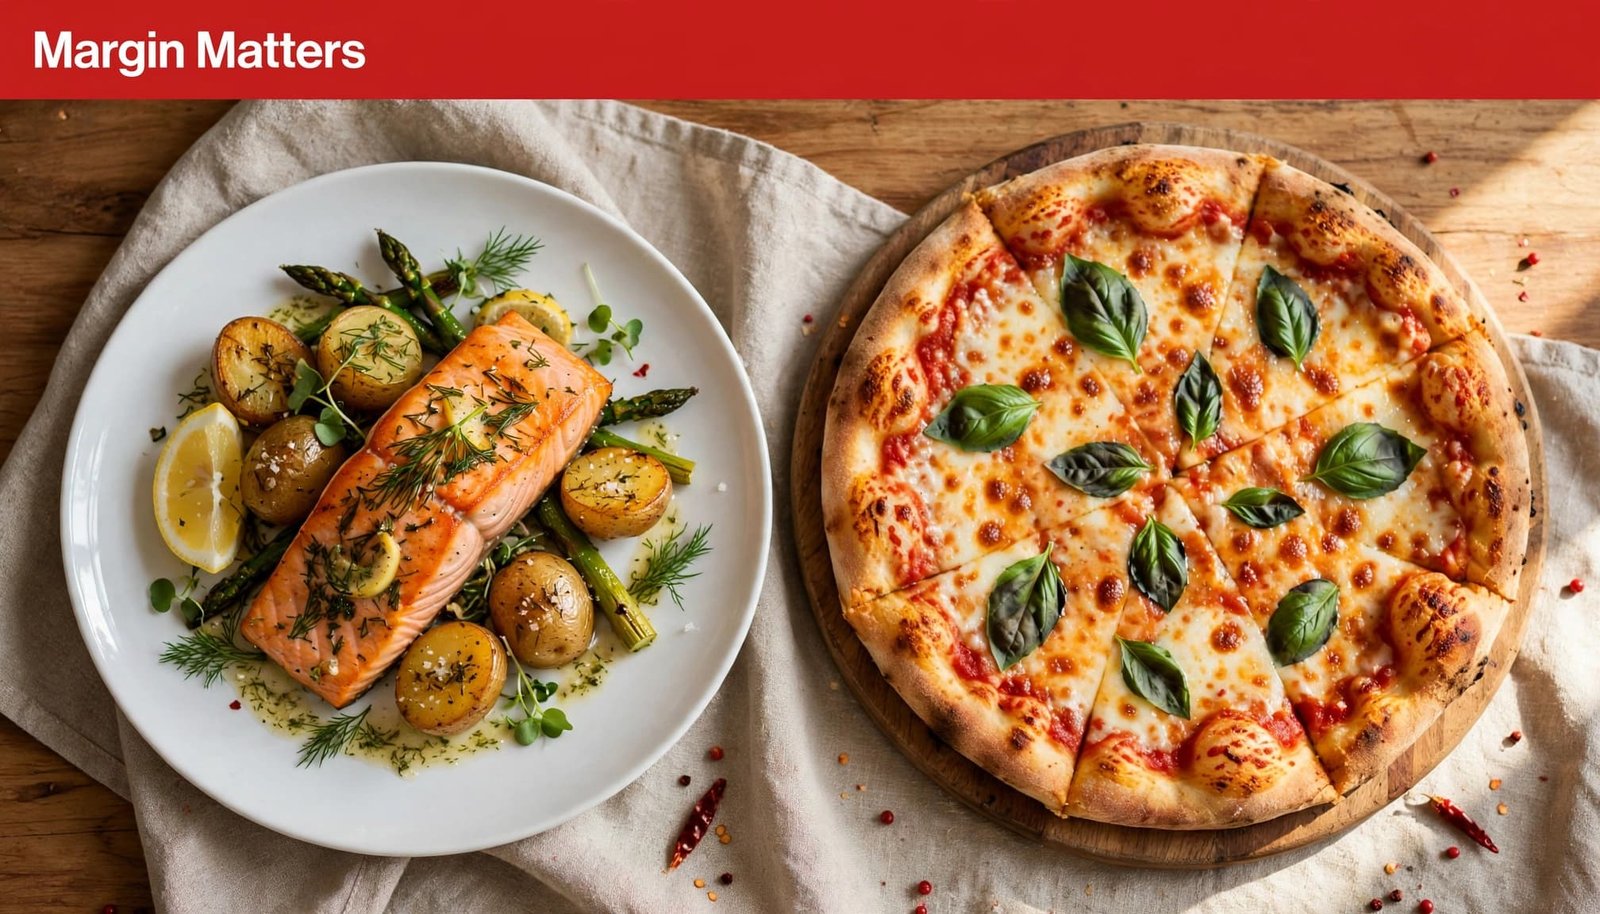
Use dollars alongside percentages
Contribution margin = selling price minus portion cost.
Food cost percentage = portion cost divided by selling price, multiplied by 100.
These calculations produce different insights.
| Menu item | Selling price | Portion cost | Food cost | Contribution margin per plate |
|---|---|---|---|---|
| Salmon | $28.00 | $9.00 | 32.1% | $19.00 |
| Margherita pizza | $15.00 | $3.75 | 25.0% | $11.25 |
| Burger | $12.95 | $3.25 | About 25% | $9.70 |
The salmon has a higher food cost percentage but a larger contribution per sale. Monthly contribution also depends on volume: multiply each item’s contribution by its orders.
Markup is different again. Pricing a $5 item at $10 produces a 100% markup on cost, but a 50% margin on revenue.
Adjust for what guests actually paid
For discounted items, divide net item revenue by fulfilled portions to calculate the realized selling price. Subtract the recipe cost to find realized contribution per serving.
Across the reporting period, subtract recipe costs for all served portions from net item revenue.
Recipe-level contribution, sometimes called gross profit dollars, isn’t the restaurant’s overall profit margin. Payroll, occupancy, payment fees, utilities, and other expenses still affect restaurant profitability. The National Restaurant Association reports labor costs above historical averages, so ingredient margin alone can’t establish restaurant profitability.
4. Measure Popularity Through Order Share
Popularity and profitability answer different questions. Sales mix shows guest demand, while contribution shows what those orders generate.
Set a category-specific popularity threshold
Sales mix = item orders divided by total category orders, multiplied by 100.
If your restaurant sells 2,000 entrees across ten options, the average is 200 orders per item, or 10% of entree sales. With a simple above-average method, items with more than 200 orders count as popular.
Compare items within meaningful categories to make your menu analysis more useful. An appetizer shouldn’t compete with entrees for the same popularity threshold.
Seasonal availability matters, too. A special offered for one week has fewer selling opportunities than a permanent menu item.
Set the profitability threshold separately
Calculate the category’s average contribution per serving by dividing total category contribution by total portions sold. Items above that average are high-contribution items.
For the pizza, portion cost is $3.75, contribution is $11.25, and its cost rate is 25%. It qualifies as a Star if it exceeds 200 orders and its contribution is above the category average.
An item unavailable during several busy shifts can look unpopular even when demand is strong. Review stockouts before changing its menu position.
Document your threshold method and use it consistently at each review.
5. Apply the Menu Engineering Matrix
The menu engineering matrix compares contribution margin and popularity across four practical categories. Each category supports a different decision.
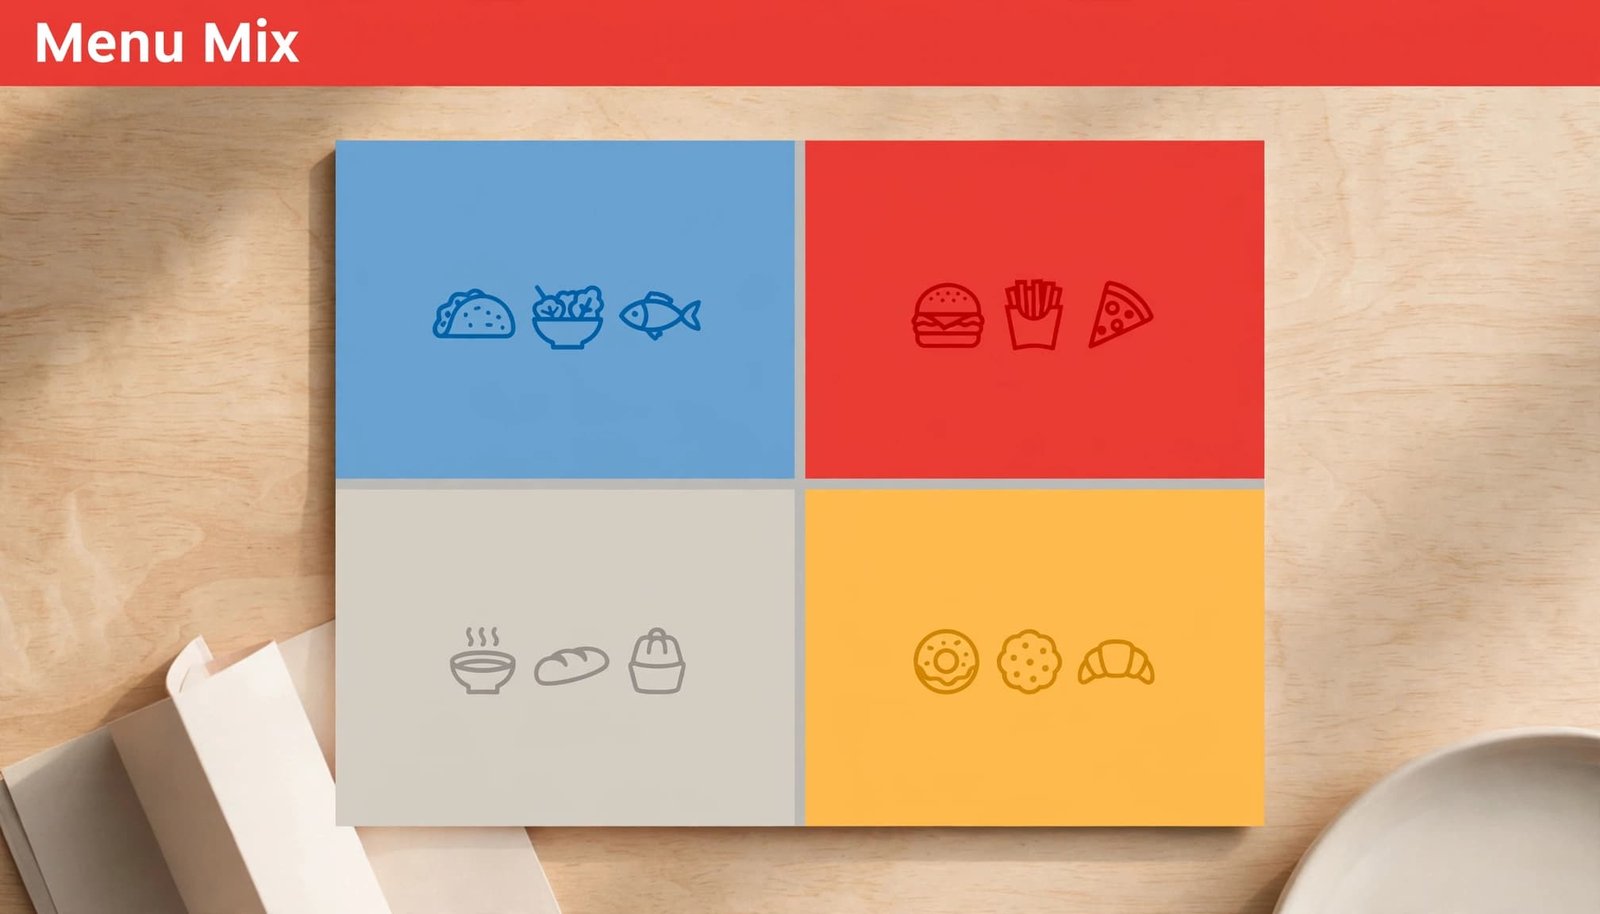
Use the menu engineering matrix to prioritize action.
| Category | Contribution | Popularity | Practical response |
|---|---|---|---|
| Stars | High | High | Protect consistency and visibility |
| Plowhorses | Low | High | Review pricing and portion costs |
| Puzzles | High | Low | Improve description and placement |
| Dogs | Low | Low | Simplify, replace, or remove |
These labels organize decisions, but they don’t replace operational judgment.
Protect Stars and improve Plowhorses
Keep Star ingredients available and train employees to recommend these dishes appropriately. Reliable preparation protects both contribution and customer satisfaction.
For Plowhorses, investigate supplier prices, serving consistency, discount frequency, and possible price adjustments. A popular Tennessee hot chicken offering deserves careful review before changing the recipe guests enjoy.
Consider preparation time as well. An item with attractive ingredient contribution can still create expensive kitchen bottlenecks during peak service.
Promote Puzzles and evaluate Dogs
Test how descriptions and placement affect Puzzle sales, then track the results. A position in the golden triangle is one placement test. Review preparation quality and guest feedback before assuming visibility is the problem.
For Dogs, assess whether removing an item would reduce waste and kitchen complexity. Retain an item when it meets a meaningful dietary need or supports valuable meal purchases.
Ingredient overlap matters. A slow seller that uses ingredients already purchased for Stars creates a different inventory burden than one requiring several exclusive perishables.
6. Use Pricing and Placement to Improve Menu Profitability
Menu pricing should account for current costs, customer expectations, and the contribution dollars each dish needs to generate.
A chicken entree with an $18 menu price and a $5 portion cost has a 27.8% food cost percentage. If that cost rises to $6.50, the percentage increases to 36.1%, while contribution falls from $13 to $11.50.
Build your target around your operating budget. At an $18 price, requiring $12 toward other expenses leaves $6 for ingredients, or 33.3%. That calculation is more useful than applying one percentage across every category.
Small beverage adjustments also deserve analysis. At ten kegs weekly and about 100 saleable pints per keg, annual volume is 52,000 pints. Adding $0.20 brings in $10,400 in additional revenue if volume stays unchanged, before related expenses.
Menu psychology can guide placement tests, but the golden triangle areas, the center, upper-right, and upper-left, aren’t guaranteed reading patterns.
Use menu psychology to test price anchoring by placing a premium option near mid-range dishes. Treat it as a test, and use accurate descriptions such as “Pan-seared Atlantic salmon with lemon-herb butter” to communicate value without changing the recipe.
Cornell’s 2009 menu-price study found approximately 8% higher spending without dollar signs in one upscale-casual restaurant. Test that approach with your own menu, and evaluate menu pricing tests by realized contribution and order volume rather than assuming the same result.
7. Track Monthly Results and Test One Change
A consistent monthly menu analysis turns POS reports into ongoing financial control. Review exceptions weekly, menu contribution monthly, and the broader menu quarterly. Update recipe costing whenever supplier prices change materially.
Keep a monthly record of category sales, net revenue, discounts, average realized price, contribution per serving, and total contribution. Include waste and relevant channel expenses. POS reports may omit labor, overhead, and other costs, so they don’t show your full profit margin.
For a price, recipe, or placement test, compare equivalent periods before and after the change. Match weekdays and service periods, and account for differences such as Nashville event traffic or university football weekends in Knoxville.
Calculate contribution per guest as total menu contribution divided by guest count. This contribution margin measure helps assess results beyond changes in traffic.
Contribution lift = new-period contribution minus baseline-period contribution.
Interpret the result alongside guest count, item sales mix, and customer feedback to judge menu performance. A price increase may improve contribution per plate while reducing orders enough to lower total contribution.
Use both periods’ actual costs to measure business results. Recalculate with a common ingredient-cost basis to separate the menu change’s effect from supplier inflation.
When reviewing POS systems for small restaurants, prioritize exportable reports, modifier tracking, and inventory connections. Those capabilities make repeatable analysis easier for your management team.
Frequently Asked Questions
What should a POS report include?
Include each item’s name, quantity sold, gross sales, discounts, refunds, and net sales. Exclude sales tax and tips, and separate service periods or sales channels when prices, portions, or costs differ.
How do food cost percentage and contribution margin differ?
Food cost percentage is ingredient cost per serving divided by selling price, multiplied by 100. Contribution margin is the selling price minus ingredient cost, showing the dollars left from each serving after ingredient costs.
How do I classify menu items in the menu engineering matrix?
Compare each item’s share of category sales with a popularity threshold, then compare its contribution per serving with the category average. High or low results on those two measures place the item in Stars, Plowhorses, Puzzles, or Dogs.
How often should I review menu results?
Review exceptions weekly, item contribution monthly, and the broader menu quarterly. Update recipe costs when supplier prices change materially, and compare equivalent periods when testing a price, recipe, or placement change.
Make Every Menu Review a Business Decision
Your POS provides the sales record, but current costs and consistent comparisons help you assess menu profitability. Evaluate demand, realized contribution, and operational impact together.
Start with one category, apply the same calculations each month, and track menu performance to support restaurant profitability. A full dining room becomes more valuable when the dishes guests choose also support your restaurant’s financial needs.